
From Our Archives: NASA SPACE: Arbitrary Selection
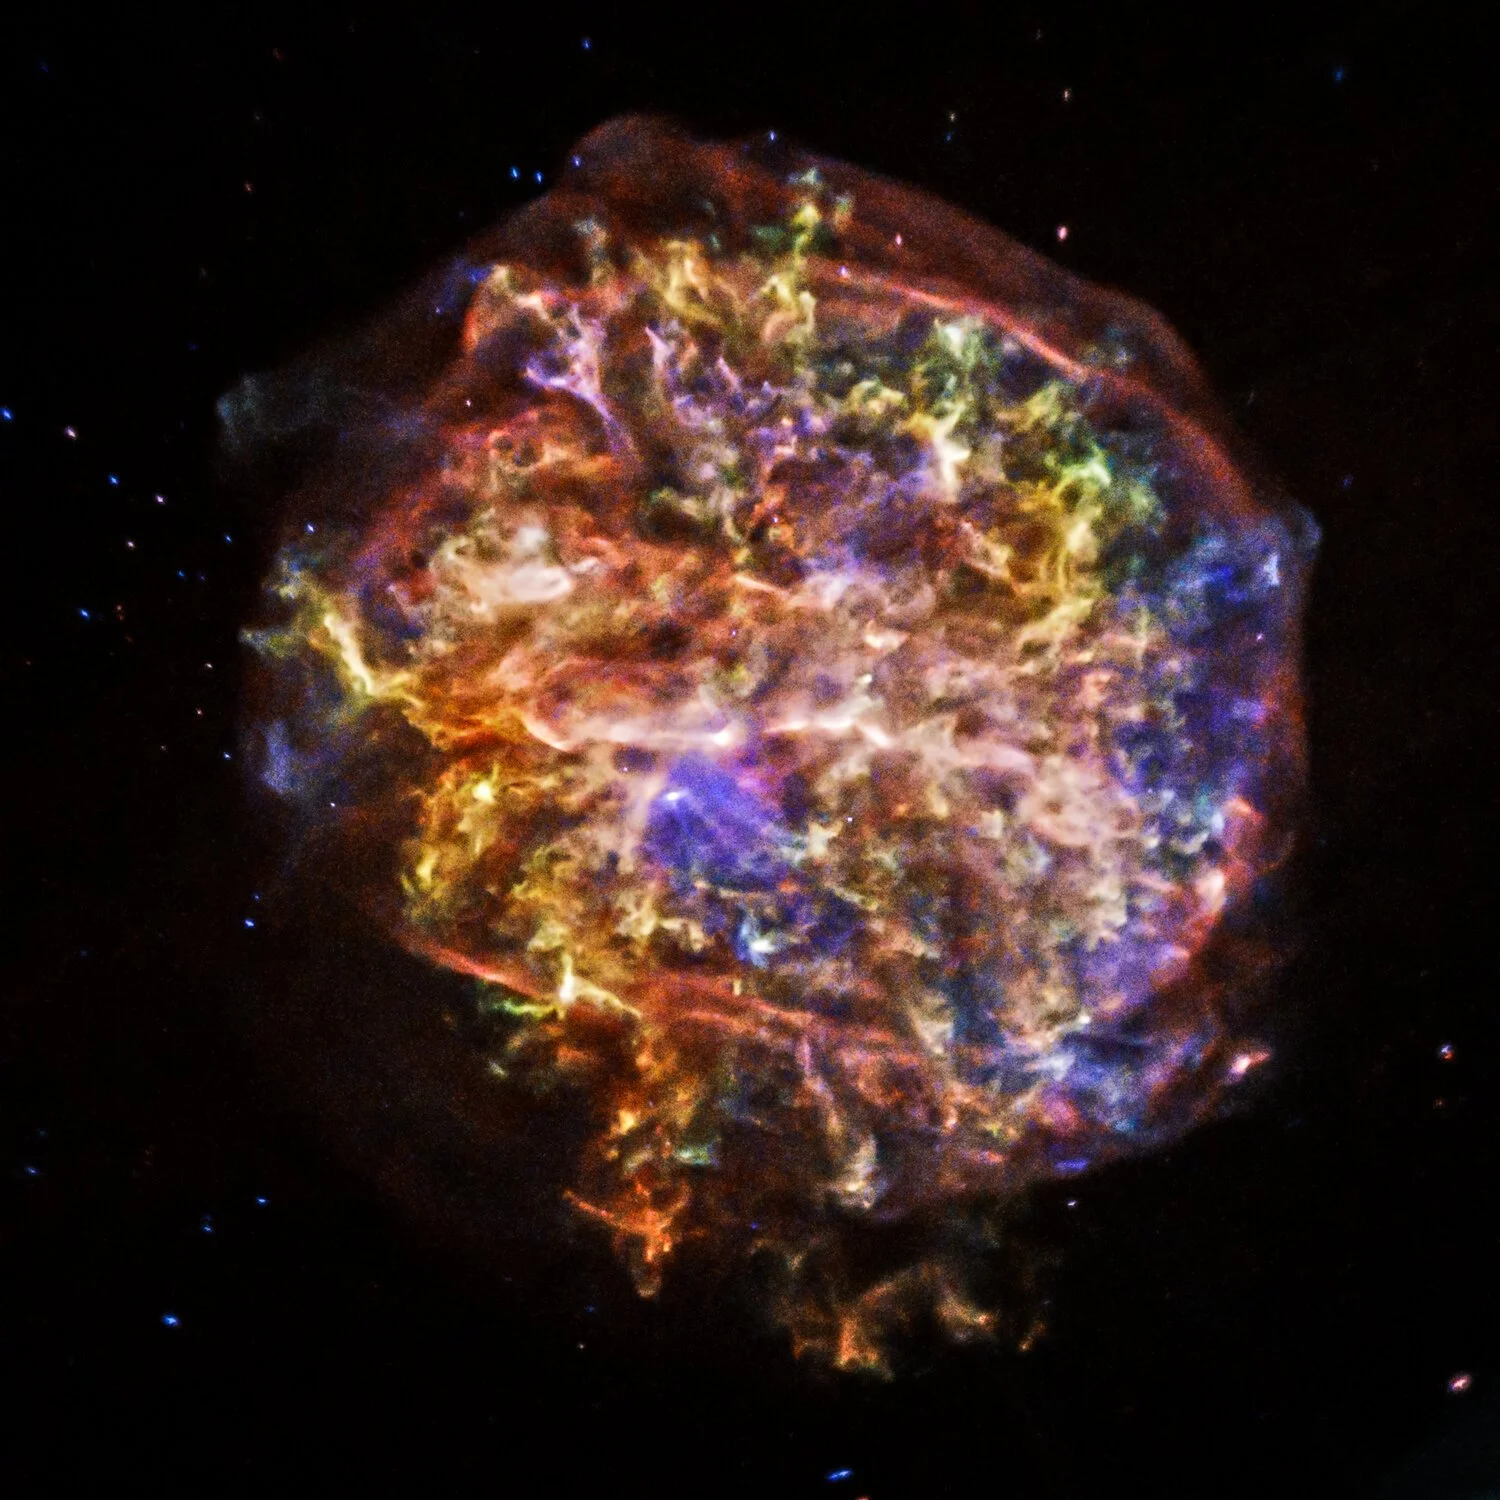
Courtesy of NASA/CXC/SAO.
This interview was featured in Issue No. 14 Science & Technology
John Hutt: Who is responsible for making the final call on the aesthetic decisions of X-ray or composite images?
Kimberly Kowal Arcand: It is not one person. The responsibility rests with, in our case, the Chandra communications group and the Chandra Mission as a whole. Our group has PhD astrophysicists, a Science Imager, a Visualization Lead, a Principal Investigator of a research team that studies how people understand cosmic images, a science writer, an educator, as well as other members specializing in computer science and data visualization.
We typically have a paper or figures from the principal investigator (PI) and scientist studying the object in question. Then our team researches that initial data to see what points we’ll be communicating, what the story of the science is. We have a science imager who then works on the data according to that initial guiding science concept, and then we meet as a group to review drafts, further refine the science being discussed, confirm points of clarity and aesthetics, and edit the visual representation until all (or most) of the group is satisfied. That version is then parsed back to the PI until they are also satisfied. Finally, the materials are circulated among another team of scientists at the CXC, MSFC, and NASA.
“Like any photograph taken, there is of course some level of subjectivity,
from the field of view selected to the colors applied.”
John: How does the process of taking an astronomical picture differ from that of a digital camera or a traditional camera?
Kimberly: When a satellite observes an object in space, its camera records photons, a packet of energy that makes up electromagnetic radiation. These recordings of packets of energy come down to Earth from the spacecraft via NASA’s Deep Space network coded in the form of 1’s and 0’s. Scientific software then translates that data into a table that contains the time, energy, and position of each photon that struck the detector during the observation. The data is further processed with software to form the visual representation of the object.
There are some major overlapping elements, the main one being the use of CCD detectors. Just like in many digital cameras, most astronomical observatories today use CCDs. To get around the scale and field-of-view issue, multiple CCDs can be used in a single camera. Astronomy also uses broadband and narrowband filters, so for example, a hydrogen alpha (h-alpha) filter will isolate the light produced by warm hydrogen gas. Filters are used to map characteristics, such as the temperature and density.
Additionally, many telescopes use spectrometers. Chandra has the High Energy Transmission Grating spectrometer (HETG). Grating spectrometers can measure energy to an accuracy of up to one part in a thousand, so they’re used to study of detailed energy spectra, distinguishing individual X-ray lines. This allows researchers to explore the temperature, ionization and chemical composition of what we are looking at.
Courtesy of NASA/CXC/KIPAC/S.
John: Is there an agreed-upon color scheme for non-visible light? Infra-Red is red, for example? What about in composite images?
Kimberly: We stick with the data in each case. There is not an absolute “standard” color scheme per se, though often astronomers assign colors in chromatic order with the lowest energy in red, middle in green, highest in blue. Sometimes (many times) that doesn’t work for the data, or isn’t the point of the data. If, for example, we want to showcase the elemental composition of an exploded star, chromatic RGB wouldn’t make sense.
John: Since we (humanity now) put a lot of stock in what we see, the immediate reaction of the viewer is to piece together an understanding based on the colors. The images should be intuitive; how do you know what is intuitive?
Kimberly: Our research project Aesthetics & Astronomy investigates just that. How do people respond to these images aesthetically and contextually, experts and non-experts alike? What misconceptions might arise based on the initial visual response?
Starting with visual processing, what an expert sees when looking at an astronomical image is not necessarily what the novice sees.
In our studies, we’ve seen that the non-expert more often moves from aesthetics to astronomy. Novices tend to begin with a sense of awe and wonder, and focus first on the aesthetic qualities of the astronomical image being shown. Experts, however, first wonder how the image was produced, what information is being presented in the image, and what the creators of the image wanted to convey.
Another area where the experts and non-experts differ is in color. Non-experts don’t consider blue to be hot, but scientists often do. Experts tend to visualize blue as hot and red as cool. When you have an astronomical image that shows hot material around a galaxy, do you color it blue or red? The primarily red image might actually convey the heat of the object better, even though its color mapping would be considered non-standard for a scientist. What is the intent of the image? For example (http://chandra.harvard.edu/photo/2006/bhcen/) was originally in an inverse color scheme of mostly blue with red loops. But a point of the science was the vast clouds of hot gas, which when colored blue looked frozen. So after testing the image, we changed it to be primarily red. It made the most sense for the data and the audience.
Read the rest of the article in Musée Magazine's Issue No. 14 Science & Technology


